


Since the publication of Executive Order 14028 in 2021, which, among many other things, directs the federal government to adopt Zero Trust architectures (ZTA), Gigamon has been investing research and development in ZTA. As of February 2024, Gigamon is tracking ten different frameworks, maturity models, and standards that claim to be Zero Trust, in addition to the foundational NIST SP 800-207 “Zero Trust Architecture,” which is the most universally accepted guidance. In our opinion, however, the Department of Defense (DoD) “Zero Trust Reference Framework v2” and the Cybersecurity and Infrastructure Security Agency (CISA) “Zero Trust Maturity Model v2” are the two seminal publications that drive the architectural evolution of ZTA for Gigamon and others. Both publications are built on top of NIST SP 800-207.
In this blog post, I want to talk about three topics of interest around ZTA. These are mostly strategic and are a call to action to architects designing ZTA infrastructures.
Thought On: ZTA Is Driven by Telemetry
This is a statement, and it is surprising to me how many security architects look at me in shock when I make this statement. What do you mean, telemetry driven? Well, let’s go back to basics and look at NIST SP 800-207 and the fundamental architectural concept:
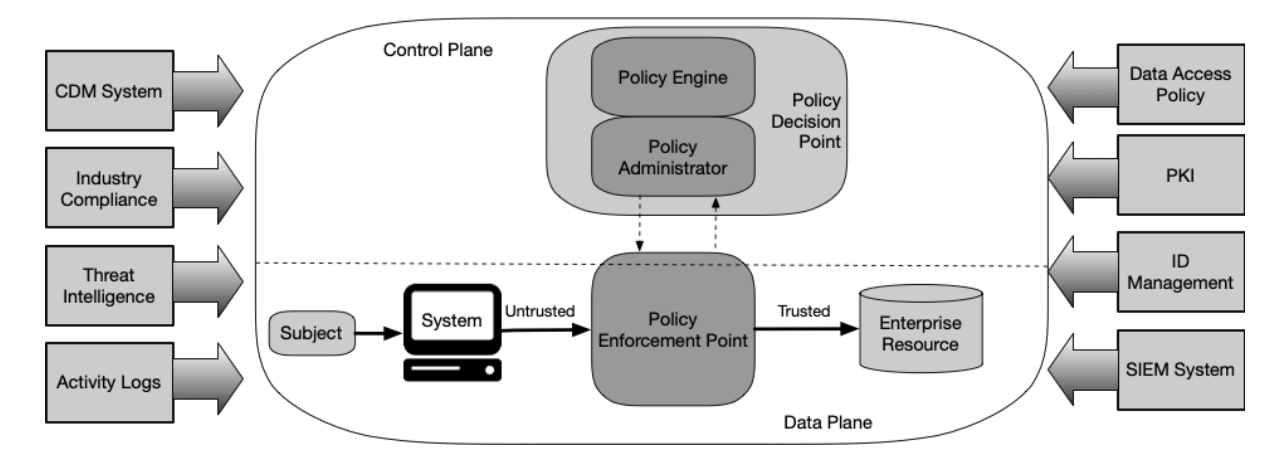
Conceptually, NIST SP 800-207 models ZTA like a network device, with a separate data and control plane. The policy decision point (PDP) is the controller, subdivided into a policy engine (PE) that evaluates risk-based decisions and a policy administrator that orchestrates these decisions.
So, what drives the policy engine? Telemetry. That is fundamentally how it works, supported by threat feeds and organizational policy.
This leads to a second realization: The higher quality the telemetry, the better the PE will work. It is trite to say, but garbage in, garbage out is still a thing. If we feed the PE poor-quality telemetry, it will not work well.
When security architects think about telemetry, they’re usually thinking about logs. At the risk of oversharing, there has been quite a large internal discussion about exactly what is and is not a log. MELT (metrics, events, logs, and traces) is one definition, obviously.
My colleague Josh Perry noted that NIST SP 800-92 does define a log, or rather specifically, a security log:
“A log is a record of the events occurring within an organization’s systems and networks. Logs are composed of log entries; each entry contains information related to a specific event that has occurred within a system or network. Originally, logs were used primarily for troubleshooting problems, but logs now serve many functions within most organizations, such as optimizing system and network performance, recording the actions of users, and providing data useful for investigating malicious activity. Logs have evolved to contain information related to many different types of events occurring within networks and systems. Within an organization, many logs contain records related to computer security; common examples of these computer security logs are audit logs that track user authentication attempts and security device logs that record possible attacks. This guide addresses only those logs that typically contain computer security-related information.”
I would argue that the differentiation of “security log” versus some other type of log can be artificial and may be problematic. In the observation of unexpected non-security errors, for example, we may find evidence of a highly stealthy intruder. Think, for example, of unusual crashes from the NIC card indicating the presence of a firmware implant running on the embedded microcontroller as a theoretical example. However, the formal definition is rather moot: What we need is visibility. Logs are not an end in themselves — I need them to see signals and posture, and they are giving me visibility into that. But what is visibility, then? I am very fond of CISA’s definition of visibility in their excellent “Extensible Visibility Reference Framework (eVRF) Program Guidebook draft”:
“In its most general sense, the term ‘visibility’ is an abstract noun describing something that is visible. CISA applies the term visibility to refer to (a) the observable artifacts of digital events and (b) the characteristics of the digital environment in which those events take place. By collecting and analyzing the observable artifacts and characteristics of an environment, organizations will have the data necessary to conduct forensic investigations into threat activity and maintain better awareness of activity on an ongoing basis.“
In a future blog post, I will describe some of the challenges around visibility and especially around visibility assurance. For those who want a preview, see my IEEE MILCIS 2023 presentation. For Gigamon’s initial feedback1 on the draft of the eVRF, where we developed an informal framework on telemetry assurance, please see this blog post.
When we are assessing our telemetry mechanisms, one thing I observe is an unconscious familiarity bias. A familiarity bias is a form of cognitive bias whereby we overemphasize (and overtrust) the familiar, and conversely, we under-trust alternative approaches that we are unfamiliar with.
Traditional logging — syslog and Windows events — are familiar. Many security architects have been using them for decades and reflexively reach for them as their first and sometimes only visibility technique. I do not think we should abandon logging, but relying on traditional OS, application, agent, and appliance logs alone is just not what we should be doing in 2024.
So, what are the alternatives?
Well, there are two: First, rely on the externally measured network behavior of monitored workloads. This is what is called deep observability, and the benefit of it is that it is usually derived from a tap or service that is outside of the monitored workload and thus very difficult for an attacker to evade.
Second, utilize telemetry from your hypervisor or capabilities like eVRF. An example of this would be Gigamon Precryption® technology, which uses eVRF to intercept encrypted traffic and send plaintext for external analysis. This analysis could be data driven2 or metadata driven, depending on the specific threat detection methodologies employed.
Thought 2: Conflating Detection and Response
The familiarity bias bites us again in another way, and that is around security controls that combine detection and response/remediation in one device or service.
This is a very familiar model to most organizations: firewalls, intrusion prevention systems (IPS), endpoint detection and response (EDR), and even legacy technologies like antivirus embody this model. This not only includes physical and virtual appliances but also agents.
But here is the challenge: It’s not the only model, and it’s not the ideal model for a fully realized ZTA infrastructure. While it may represent an early first-stage deployment for an enterprise ZTA, there are three fundamental problems with the conflation of detection and response capabilities into a single control:
- The response capability is primarily designed to be leveraged within the context of the tool’s specific ecosystem. In the ZTA context, any logical reading of the architecture suggests that the primary control should be exercised by the PDP, not by the tool itself.3
- Compromising the individual control potentially compromises both detection and response capability.4 This is exacerbated if the tool is a physical or virtual appliance, which adds the entire OS environment to the detection and response capability, and there is ample evidence that such appliances are high-priority targets for nation-state threat actors with numerous recent and current examples.
- A specific tool or control may have an excellent detection or response capability, but unless it’s best of breed for both, we are forced to accept the less impressive side too. If they’re separate, we choose the best of both.5
- While we can feed detected incidents to the policy engine, most will provide insufficient context for the policy engine to work effectively (see Thought 3).
In fairness, there are positives to this combination as well:
- The latency from detection to response can be minimized, which can be valuable for known-bad TPPs with low false-positive rates. That is a fair point.
- A single tool has a lower learning overhead, may cost less, and may have other benefits — basically, the whole tool consolidation argument, with all the inherent risks and inefficiencies which one accepts if pursuing this strategy.
I would argue that the separation of detection capability and response capability is highly desirable. This is not a familiar model, but that’s fine once we discard our familiarity bias and look at what ZTA needs.
Thought 3: Ignoring the Value of Telemetry Correlation
When Gigamon started on this ZTA R&D journey in 2021, one of the earliest approaches we took was to understand a data-science driven approach to telemetry. Specifically, what sort of data could we feed the policy engine, and in what format, to make it work best?
You can look at telemetry domains, which the eVRF calls visibility surfaces. I’m going to stick with telemetry domains for the rest of this blog post. In most organizations, they are distinct and treated differently, primarily because most detection tools are designed to ingest only their own telemetry data.
So, let’s consider the telemetry triad: traditional logs (MELT) from the operating system or application, telemetry from security agents, and the network behavior of a system or service measured from the network.6 Very different types of telemetry, right? Not useful together?
Well, no. Actually, they’re incredibly useful to correlate, and when combined and both positively and negatively correlated, provide incredible insight into both normal and atypical actions (that is, potential threats) inside your ZTA environment.
The asymmetry in task between attacker and defender is well documented, with some pointing to Karl von Clausewitz’s “Vom Kriege” (1831) as the original source of this observation. It is harder to be a defender than it is to be an attacker, generally. However, once inside our Zero Trust infrastructure, the role of attacker and defender reverse, with the PDP becoming the attacker and the defender being our intruder. This is why attackers routinely practice evasion, and it is a phase in the MITRE ATT&CK framework. Under the framework, Defense Evasion has 43 documented techniques, the largest of any phase.
So, think like an attacker: Each of these techniques is specific to a particular type of telemetry domain or visibility surface, and actually enabling evasion techniques generally affects only one and may actually increase the telemetry for another. For example, an attacker downloading a Python script to constantly recycle /var/log/messages with updated timestamps while disabling actual logging is going to generate extra network traffic while doing so. It’s also going to generate an EDR entry that a new executable file has been created.
But also, normal (non-risky) operations will also see unique clusters of different telemetry domains operating together. This sort of clustering is perfect for AI/ML techniques to characterize and report on. This is very much how the policy engine should work, but it requires reasonably dense telemetry from controls to achieve. A tool just saying “I detected a threat” here isn’t useful for this sort of analysis.
In the second version of CISA’s Zero Trust Maturity Model (pp. 21–22), under the “Optimal” column of “Visibility and Analytics Capability,” they note:
“Agency maintains visibility into communication across all agency networks and environments while enabling enterprise-wide situational awareness and advanced monitoring capabilities that automate telemetry correlation across all detection sources.”
(My emphasis added.)
Although this was feedback we gave CISA on v1 of their document, we have no idea whether the recommendation came from our feedback, or from a reasonable and independent analysis of the operation of a policy engine. But it makes sense, irrespective of the source.
While threat detection can be done with minimal telemetry beyond alerts from individual tools, the characterization of “normal” or “minimal risk” vs. “abnormal” and “indicative of risk” will require more than we typically get from security tooling. It will require dense application and OS logging, network behavioral characterization, and analysis of data in use—in motion and at rest. It will be the correlation of this dense data that makes Zero Trust work well, and we need to architect for this today.
One closing comment on the issue of telemetry domains/visibility surfaces: while it is totally acceptable and arguably unavoidable to have different data formats across different telemetry domains, it is highly desirable to have the same format within multiple environments covered by the same telemetry domain. Let me clarify this with an example: while agent-sourced telemetry and network-traffic sourced telemetry will necessarily be in a different format and contain different data elements, it’s highly undesirable for network-traffic sourced telemetry to have a different format when derived from on-premises networks, virtual networks, and public cloud networks. They should be in largely the same format, meaning that no normalization is required for ingestion. This will enable easier correlation of activity across multiple environments, so an attacker’s tactics, techniques, and procedures (TTP) deployed in a public cloud environment versus on prem will be detected readily, and your data taxonomy does not have gaps for some environments that a malicious threat actor could deploy.
Gigamon acknowledges the value of common telemetry data formats, as they make ingestion so much easier. However, a common telemetry data format can also become a straitjacket and result in either compromised data transmission (elements are dropped because they don’t fit in the taxonomy, for example) or random extensions that nobody supports.
Conclusion
I’m going to make a very provocative statement: If you are building a Zero Trust architecture and you’re not thinking about feeding a policy engine, then I question whether you are really doing Zero Trust at all or something else and just calling it Zero Trust.
The policy decision point, consisting of a policy engine and policy administrator, is the core of a Zero Trust architecture. Without it, you just have a collection of controls and maybe a SIEM: nothing we haven’t been building for 20 years now. That is not Zero Trust.
Policy engines are driven by telemetry. This means more than just OS and application logs, and the richer the data we feed it, and the more different telemetry domains we can find, the better it will be able to work. Moving forward, the deployment of learning algorithms and AI, like user and entity behavioral analytics (UEBA) but deployed through the enterprise, will truly deliver a significant improvement in posture by identifying anomalous behavior early. However, it will need to be fed by high-quality telemetry to avoid both false positives and false negatives.
Finally, let’s stop thinking about consolidated controls as the default, or even preferable, because for Zero Trust, detection and response are different actions, and there are major benefits to this separation, especially for Zero Trust.
As with all Gigamon blog posts, I invite your feedback and thoughts.
1. As a general rule, Gigamon publicly publishes our feedback on U.S. government standards. We do so for three reasons: (1) to engage those developing and consuming standards in an open and honest way; (2) to share what we believe are useful and relevant observations in a vendor-neutral way; and (3) to encourage other companies and organizations to do the same.
2. Just a reminder to any vendors who say, “The key to ZTA is identity,” or “The key to ZTA is our agent”: Refer to NIST SP 800-207, p. 1, which clearly says the “ZT approach is primarily focused on data and service protection.” ZTA is data-centric, and this extends to the services that handle that data. It is not system, or identity, or network-centric at all. The core of ZTA is protection of data. This is why the author personally prefers the DoD and Forrester diagrammatic models, which centralizes the data, versus the pillars model CISA has produced.
3. Note that the DoD ZTA Reference Architecture v2 uses different nomenclature and refers to the NIST SP 800-207 policy decision point as the Data Analytics & AI (SV-1) capability (figure 17, p. 44). The discussion in section 4.7 on page 45 discusses the value of being able to orchestrate actions across multiple domains of influence, which would constitute enforcement tools for our purposes here.
4. Defense in depth (layered security) has been an infosec concept for at least six decades now. If your ZTA is entirely dependent on a single control, then you are implicitly trusting a single control. Are you really doing ZTA? From NIST SP 800-207, p. 1: “Zero trust security models assume that an attacker is present in the environment.” You need to assume that everything is potentially compromisable, including your ZTA infrastructure, and plan to detect that and respond appropriately.
5. Also, think about replacing one capability while retaining the other.
6. I have recently started to talk about the telemetry triad having 3.5 sides. What is the 0.5? It’s telemetry from the hypervisor, or the container infrastructure, which is not running in the same environment as the container or VM. It’s only available in some environments, hence 0.5. eVRF is also a technology that could qualify as this, under some definitions.
Featured Webinars
Hear from our experts on the latest trends and best practices to optimize your network visibility and analysis.

CONTINUE THE DISCUSSION
People are talking about this in the Gigamon Community’s Zero Trust group.
Share your thoughts today