


The desire to analyze and secure the increasing volumes of data has made visibility a critical investment layer in any modern infrastructure deployment. In the process, the visibility layer provides an important layer of abstraction that enables connected security and monitoring tools to get access to traffic anywhere in the infrastructure.
But can this layer of abstraction create obfuscation? How do you determine the origin of a specific flow that is reaching a security or monitoring tool? For example, if your security tool attached to the visibility infrastructure is blaring sirens that a certain flow has issues, how do you reduce Mean Time to Resolution (MTTR) by quickly tracing back the hotspot in the network, and more specifically, the network interface that was the cause of the hotspot?
You can do it in one of two ways:
1. The old fashioned manual way. Find the ingress interface (network port) on the visibility infrastructure. Identify which TAP (or SPAN port) it is connected to and then trace back the cable to the real network interface in a production network. Not to mention lots of spreadsheets, sticky notes and wasted midnight hours!
2. Or use a topology visualizer that automatically discovers the connected production network and displays the end-to-end connectivity from the source (network) to the visibility layer to the tools.
At CiscoLive today, Gigamon is pleased to announce a new capability – automated network topology visualization in GigaVUE-FM Fabric Manager, the single-pane of glass application for managing visibility infrastructure at scale.
Designed specifically for large data centers, this new capability enhances the ease of use and administration of network visibility by providing end-to-end visualization of the Visibility Fabric™ components, associated production networks and interfaces from which traffic is sourced and the connected security and monitoring tools that analyze this traffic.
Gigamon constructs the data center topology through automated discovery of the attached networks using the Link Layer Discovery Protocol (LLDP) or Cisco Discovery Protocol (CDP). When security and monitoring tools attached to Gigamon’s Security Delivery Platform detect abnormal behavior, an administrator can quickly trace back to the network interfaces at the source of the abnormality, significantly reducing the mean time to resolution (MTTR). Gigamon’s leverage of common protocols minimizes manual tasks and enables visualization of various data center infrastructures comprised of networking products from best of breed vendors.
Below is a screenshot of the newest release of GigaVUE-FM that shows end-to-end topology with auto-discovery of the production network and other monitoring tools imported by GigaVUE-FM.
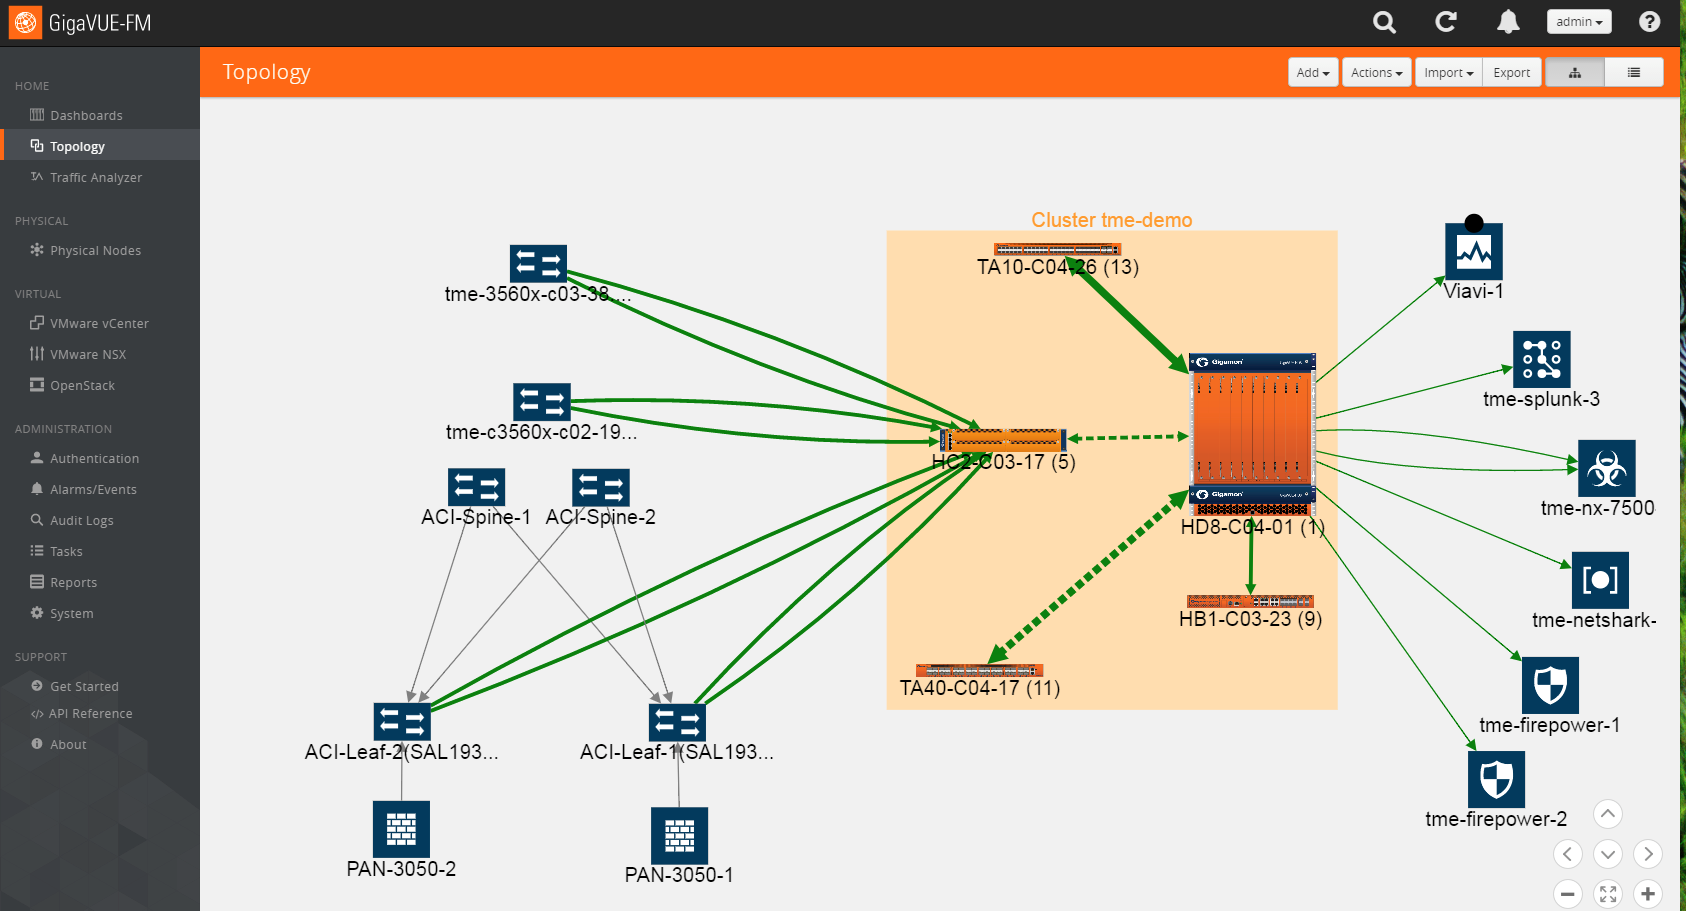
While the above topology in a modern data center is based on Cisco ACI, here is another topology in a multi-vendor deployment that leverages LLDP discovery.

This network information (switch, router, etc.) is not just limited to the topology. When a Gigamon Visibility FabricTM is deployed, there are two other ways for other systems in the data center infrastructure to extract this information:
- Export this information via REST APIs in the Visibility Fabric so that tools to construct their own contextual visibility. This mechanism is part of a broader framework called Software-Defined Visibility
- Include this information as part of IPFIX and NetFlow records that the GigaSMART Metadata engine generates, which can be used by the security tools to identify the activity path of nefarious activities.
To see this in action, visit the Gigamon booth (#2227) at CiscoLive 2016 in Las Vegas.
For additional information, refer to the GigaVUE-FM Product Brief and Metadata Solution Overview.