


Unveiling the New TLS/SSL Dashboard from Gigamon: A Comprehensive Solution for Enhanced Network Security and Performance
In today’s digital landscape, ensuring secure and efficient data transmission is paramount. The TLS/SSL Dashboard, released in GigaVUE 6.7, offers a robust solution for monitoring and managing encrypted traffic. These dashboards provide comprehensive insights into TLS/SSL sessions, enabling organizations to maintain high levels of security while optimizing network performance.
Additionally, the TLS/SSL Dashboard simplifies troubleshooting and enhances compliance efforts by providing contextualized data and logs. With historical data readily available, it supports rigorous compliance and auditing processes, making it an essential solution for NetOps and SecOps teams, IT professionals, and network administrators aiming to maintain high security and operational standards. Powered by GigaVUE-FM, the dashboard not only streamlines network operations but also ensures that organizations can easily adhere to strict regulatory standards.
Leverage the Power of the TLS/SSL Dashboard
The TLS/SSL Dashboard is part of the Fabric Health Analytics (FHA) in GigaVUE-FM fabric manager and is structured with several key tabs, each designed to offer specific insights and functionalities:
- Session Overall
- Session Engine Overview
- Traffic Insights
- Session Insights
- Session Table
- Engine Diagnostics
These tabs collectively provide a holistic view of the network’s TLS traffic, enabling users to monitor, analyze, and optimize their network environments effectively.
Understanding System Operations: The Session Overall and Session Engine Overview tabs provide both broad and detailed views of system operations, offering insights into the health and performance of TLS sessions. This information is crucial for maintaining system integrity and preemptively addressing potential issues.
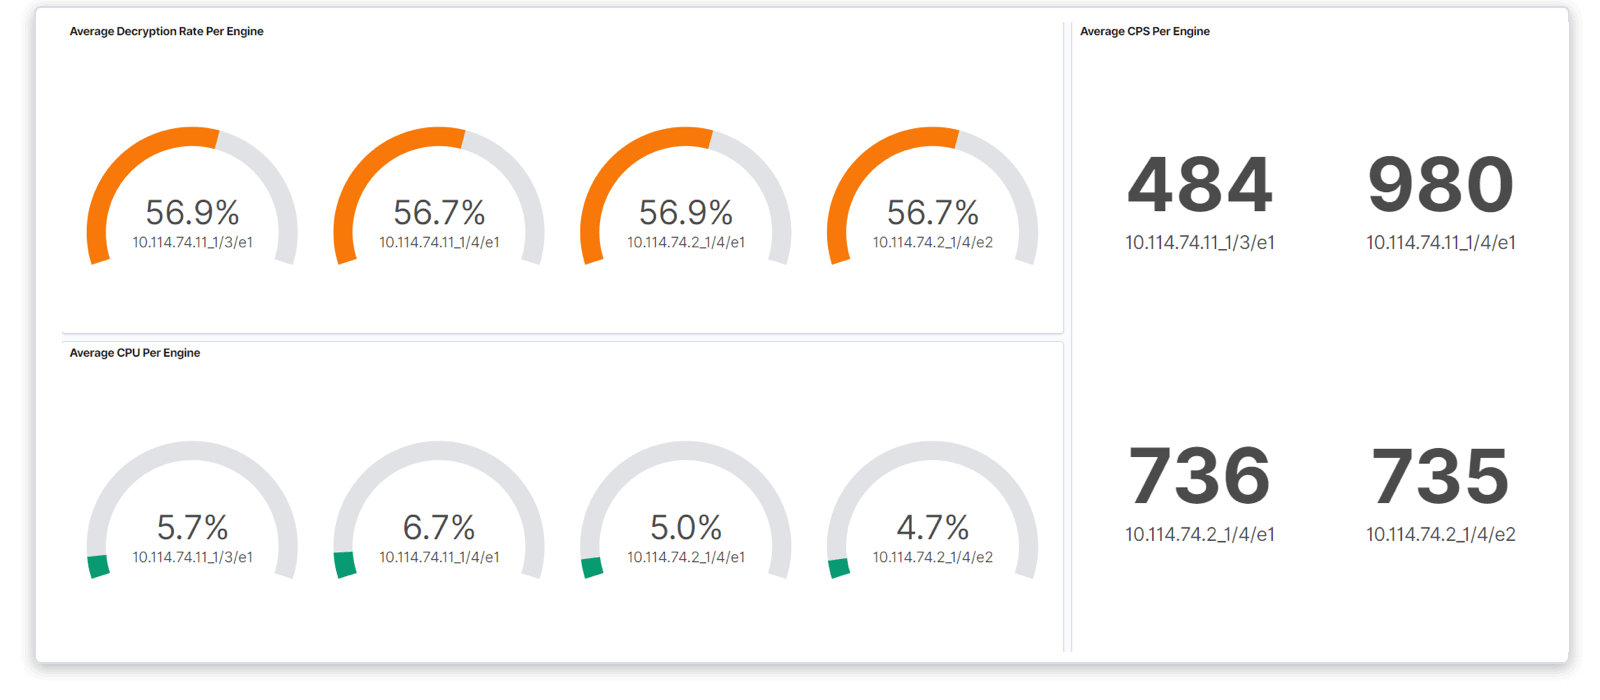
Evaluating System Performance: Through the Engine Diagnostics and Session Engine Overview tabs, users can access critical performance metrics such as CPU usage and memory utilization. This data helps determine if the system is sized correctly and performing optimally, guiding decisions on necessary upgrades or adjustments.
Network Capacity Planning: The Traffic Insights tab delivers essential data on connection rates and concurrency numbers, key for evaluating network capacity and scalability. This information is vital for managing peak loads and ensuring robust traffic handling without service degradation.
Historical Data Analysis: The Session Table and Session Insights tabs allow for the exploration of historical data to identify patterns or anomalies, aiding in the proactive management and resolution of potential issues.
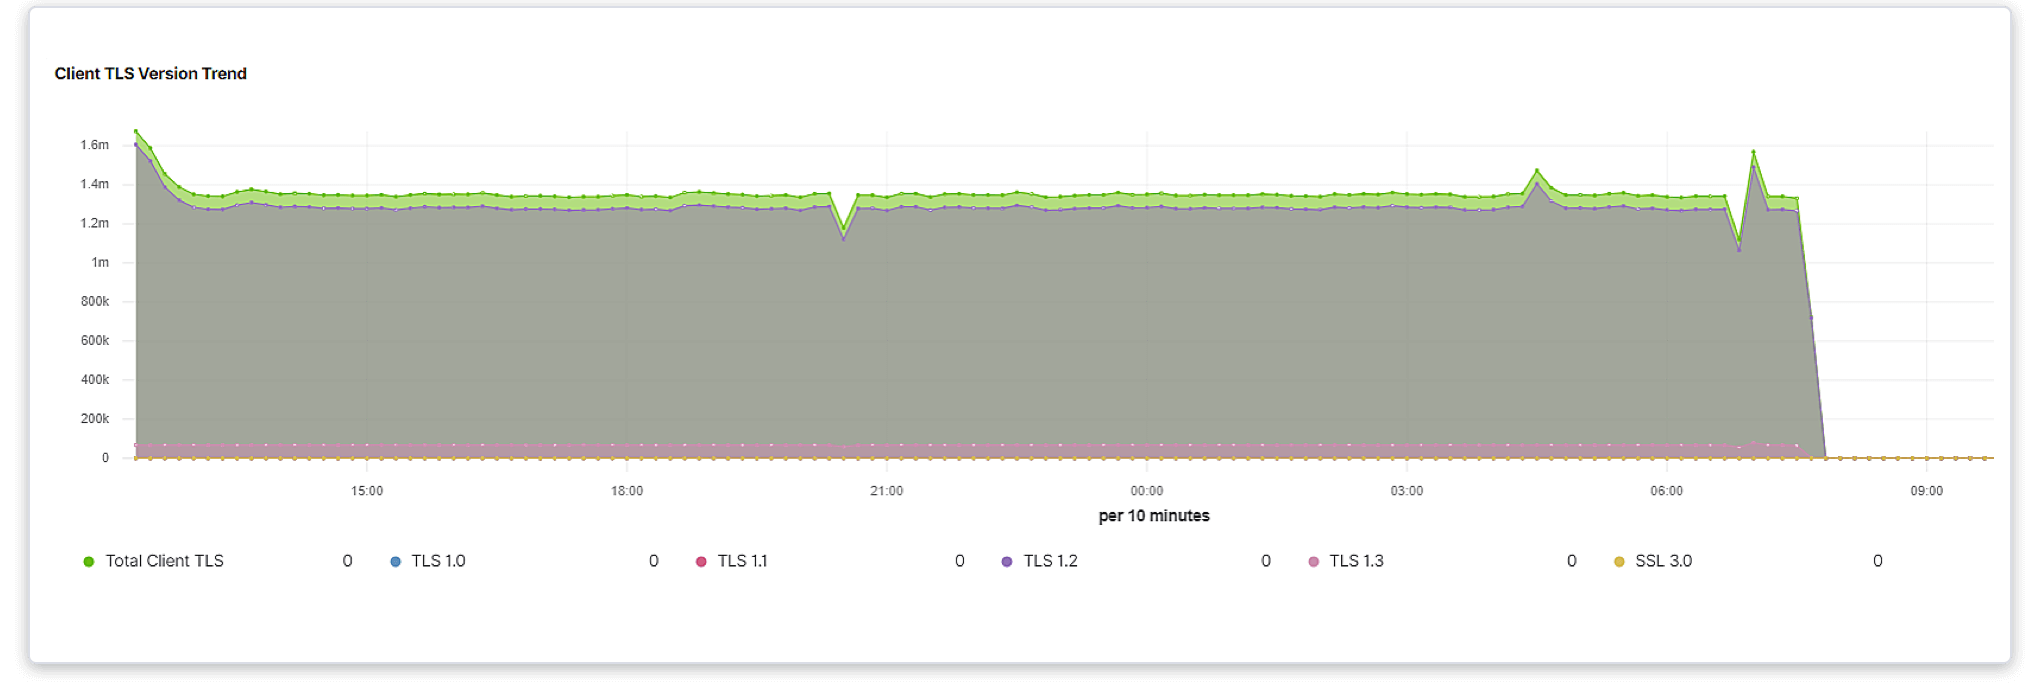
Security Settings Assessment: The Session Insights tab provides detailed information on TLS versions and cipher suites, ensuring the use of secure and compliant encryption standards critical for protecting data in transit.
Traffic Decryption and Compliance Analysis: The Traffic Insights tab provides analytics on decrypted traffic percentages and compliance, which is crucial for organizations under strict regulatory standards. This enables users to effectively monitor how policies impact their TLS traffic.
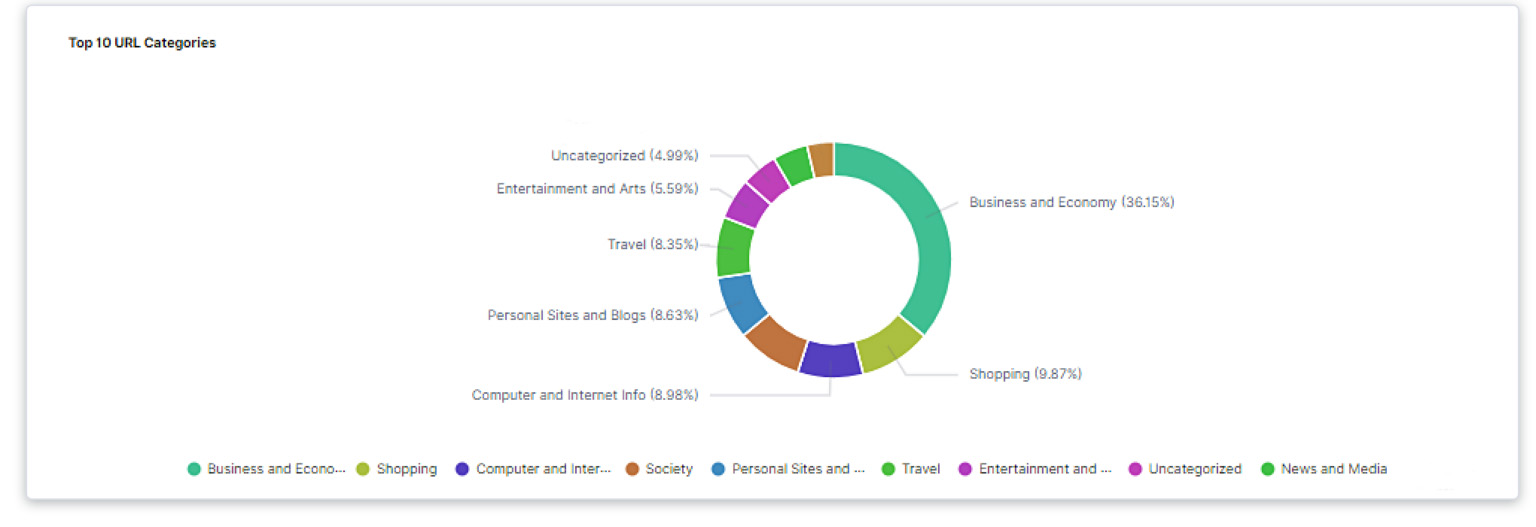
Identifying URLs and Endpoints: Detailed information about URLs involved in decrypted traffic and connection endpoints is accessible via the Session Table, enhancing network visibility and supporting security audits and forensic analysis.
Report Generation: The dashboard enables the generation of detailed reports from collected data, supporting strategic decision-making, and is useful in compliance audits, performance reviews, tracking trends over time, and security assessments.
Conclusion
The TLS/SSL Dashboard is an invaluable resource for NetOps and SecOps teams, offering them a user-friendly interface with deep analytical capabilities. It ensures that networks are secure, compliant, and operating at optimal performance, making it an essential solution for fast troubleshooting and proactive network and security management.
Ready to Elevate Your Network Security and Performance?
Discover how the TLS/SSL Dashboard can transform your network management and security strategy. Download the data sheet, visit the GigaSMART® TLS/SSL web page to learn more, or contact us for a personalized consultation to hear how the TLS/SSL Dashboard can be tailored to meet your specific needs.
Featured Webinars
Hear from our experts on the latest trends and best practices to optimize your network visibility and analysis.

CONTINUE THE DISCUSSION
People are talking about this in the Gigamon Community’s Security group.
Share your thoughts today