


For Every kWh Invested in Gigamon, Organizations Can Save Up to 11 kWh, Reducing Power Consumption, Carbon Emissions, and Energy Costs1
Questions like “How can I do better by my organization’s bottom line?” and “How can I do better by our planet?” run through organization leaders’ minds daily. Increasing economic and environmental pressures are shaping business priorities and practices more and more each passing week.
In my recent article, “How to Put Your ‘Carbonivore’ Data Center on a Diet,” I discussed how data centers currently consume about 3 percent of global electricity and account for roughly 2 percent (and rising) of all global carbon emissions — equivalent to the entire airline industry. For reference, the entire energy sector from the manufacture of fertilizers, pharmaceuticals, refrigerants, oil, and gas extraction accounts for 3.6 percent of global carbon emissions.
It’s perhaps no surprise that our customers are telling us that energy efficiency — and carbon emissions — matter. Reducing operational complexity is a cornerstone for all Gigamon efforts, which naturally lends itself to helping our customers reduce power consumption and energy costs.1
We’ve been working extensively behind the scenes to validate and quantify how Gigamon can support our customers’ growing demands for energy efficiency. And we’re pleased to share that now we can demonstrate and prove these capabilities.
Introducing Our Power Savings Calculator
We recently expanded our popular Cost Savings Calculator to now include a Power Savings Calculator that enables our teams to provide customers with a true sense of the energy reduction opportunities within their unique tools infrastructure. This, in turn, enables customers to calculate the overall energy reduction opportunity across their hybrid cloud infrastructure.
By inputting existing hybrid cloud infrastructure parameters, including the volume of network traffic sent to tools and the annual growth rate in network traffic, the Power Savings Calculator enables organizations to see where energy efficiencies are possible. This information enables IT teams to calculate the corresponding cost savings and reduction in carbon emissions unique to their hybrid cloud infrastructure and tooling.
Hidden Costs, Hidden Carbon
Many data center operators focus on physical plant management, taking the underlying traffic processing as a given. This means they might overlook the redundancy of network traffic processing. Organizations of all sizes should explore the hidden costs and underlying carbon impact of the tooling that surrounds their core data center operations to uncover the true savings potential.
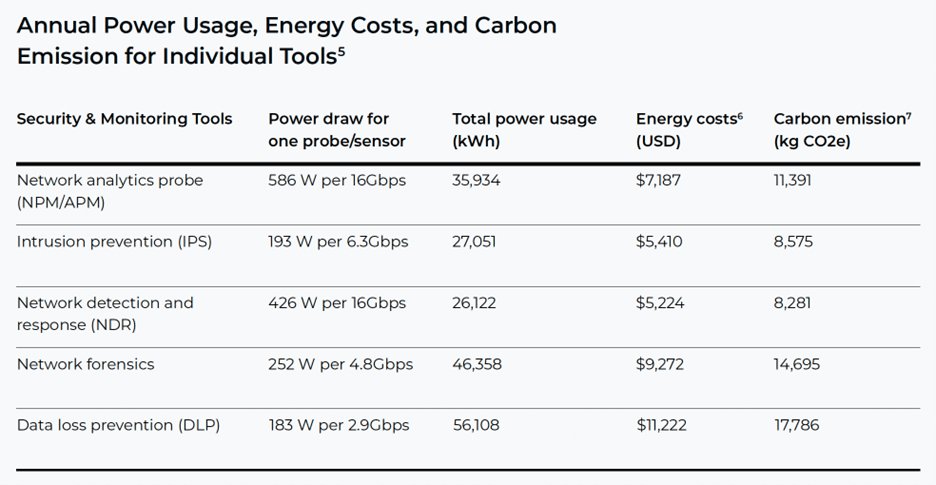
For example, one of the popular network analytics probes used across service provider and enterprise infrastructure consumes nearly 600 W of power to process 16Gbps of network traffic. Monitoring 100Gbps of data center traffic would therefore require up to seven individual probes, totaling up to 4,100 W of power.2
A year’s worth of monitoring with this single tool consumes up to 35,934 kWh of power,3 the equivalent of about 100 home refrigerators. See Table 1 below for a summary of both the estimated cost and carbon impact of running security and monitoring tools at scale in the data center.
How Does Gigamon Help Customers Reduce Carbon and Costs?
One of the most strategic ways to approach the goal of reducing power consumption and energy costs along with underlying carbon emissions is to determine what network traffic is processed by which tools. For every kilowatt-hour invested in Gigamon, organizations can save up to 11 kilowatt-hours or more in tool efficiencies by significantly reducing network data processing.4
The Gigamon Deep Observability Pipeline enables our customers to gain visibility and streamline efforts across their data centers by applying the following techniques:
- Application Metadata: Application Metadata extracts and summarizes application, protocol, and session context about network traffic, efficiently delivering this Layer 4–7 intelligence to third-party tools, such as security, observability, and performance monitoring tools.
- Application Filtering: Application Filtering identifies well-known applications by traffic signature, even when encrypted, creating a triage system of high-risk and low-risk data by filtering out traffic from high-volume trusted apps.
- De-duplication: De-duplication identifies and removes duplicate packets before sending network data to tools, resulting in fewer redundancies.
- Flow Mapping®: Flow Mapping sends specific subnets, protocols, VLANs, and other types of traffic to specific tools to ensure that only the relevant network data is sent to address each tool’s unique requirements.
- Flow Slicing: Flow Slicing is a highly efficient optimization method that drops non-initial packets in every user data session.
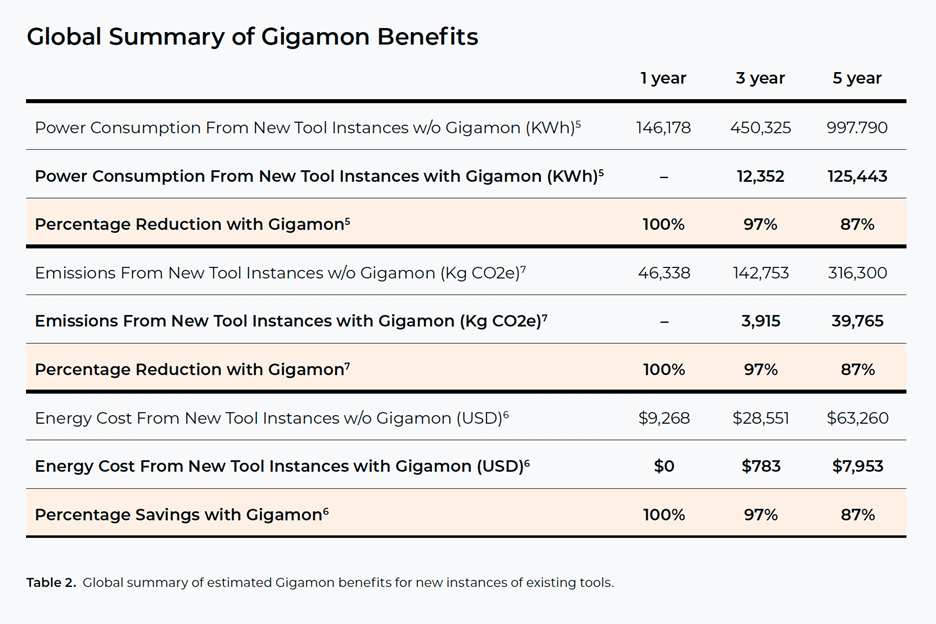
In the scenario above, our customers could reduce the power consumption, carbon emissions, and energy costs of their tools infrastructure by as much as 87 percent over a five-year period. That’s good for the bottom line and our planet.
If you’re interested in seeing an energy-savings or cost-savings model for your tools, contact the Gigamon Network Efficiency Appraisal Team at [email protected].
References
1, 2, 3, 4 For more information on the value of data center carbon reduction, please read the Gigamon whitepaper, “Beyond the Physical Plant: Reduce Energy Usage Before It Begins.”
6 CO2 conversion uses 0.317 kg of CO2 emission per kWh, based on averaged figures from carbonfund.org. This will also vary depending on the energy source.
7 Power draw wattage determined assuming engineered capacity typically as 80 percent of max. capacity.
Featured Webinars
Hear from our experts on the latest trends and best practices to optimize your network visibility and analysis.

CONTINUE THE DISCUSSION
People are talking about this in the Gigamon Community’s Security group.
Share your thoughts today