


The Dynatrace Software Intelligence Platform combines broad and deep observability and continuous runtime application security with the most advanced AIOps (artificial intelligence for IT operations) and automation to provide answers and intelligent automation from data at an enormous scale. Dynatrace understands your ecosystem and delivers precise answers through explainable, causal-based AI with automatic discovery and topology mapping across billions of dependencies.
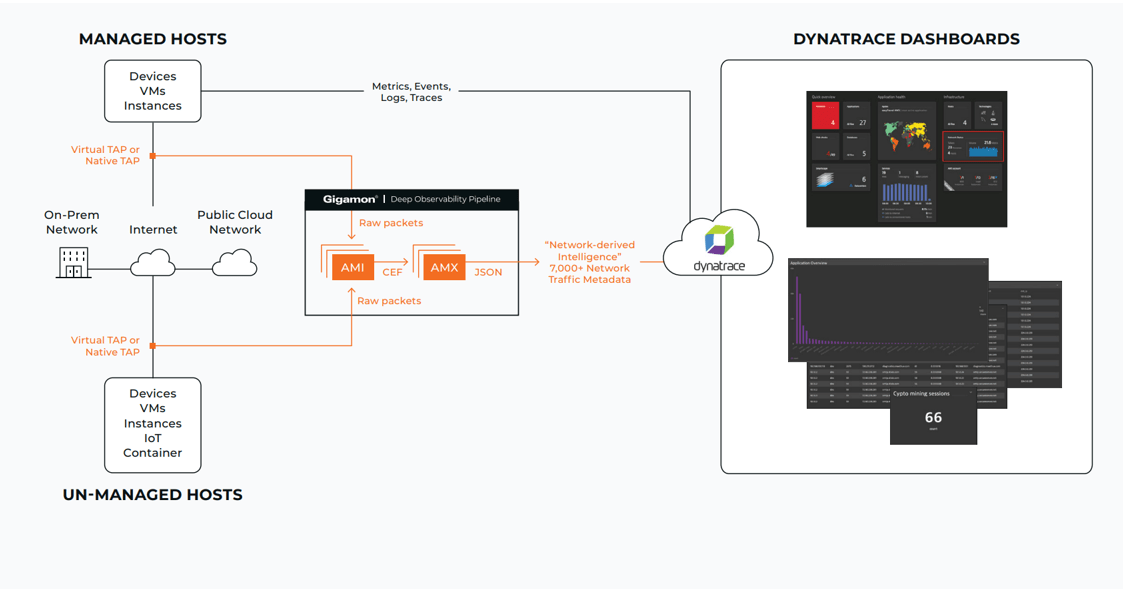
Gigamon offers a deep observability pipeline that harnesses actionable network-level intelligence to amplify the power of observability tools. Through our Application Metadata Intelligence (AMI) technology, Gigamon offers a bottom-up view of data in motion in on-prem and multi-cloud environments. This offers broad East-West visibility of actual data, protocols, and applications (both good and bad) in motion giving NetOps, CloudOps, and security teams full visibility into application traffic running in datacenters and public clouds.
Gigamon and Dynatrace complement each other and bring complete network, application, end-user, infrastructure observability to hybrid cloud IT landscapes. If the Dynatrace platform detects a customer-impacting problem with an application or any of its dependencies, CloudOps teams can quickly review the application network health for areas such as DNS queries, packet transmissions, and latency. Conversely, if Gigamon detects compliance issues related to SSL and cipher versioning or security risks related to vulnerable protocols, port spoofing, or crypto mining, these issues can be immediately put in context of the applications and infrastructure as known by Dynatrace.
Here are a few use cases that are enabled by the joint Gigamon and Dynatrace solution:
- Are the applications communicating as usual, or did anything change in their network profile after recent upgrades?
- Are they speaking using vulnerable protocols or deprecated ciphers? Are the required TLS certificates still current?
- What other network traffic is competing with the key apps traffic, is it affecting the app connectivity, and what is it that occupies the same network segments that my app uses?
How Does It Work?
Referring to Figure 1 below, Gigamon leverages deep packet inspection to identify over 5,000 common and proprietary applications. Relevant application, application family, protocols, and attributes can be filtered and streamed to Dynatrace’s Log Management and Analytics solution. Powered by Dynatrace’s purpose-built observability data lake house Grail, users can analyze Gigamon network data in context of traces, user sessions, and topology with intuitive visual diagnostics and powerful queries.
Use Case Illustrations
Below are examples of what insights can be gained through visualizations within Dynatrace from the Gigamon ingested data.
#1 Applications with long round-trip times
Figure 2 shows that there are high round-trip times for AWS, Google, Teams, and Salesforce. This view adds context to the network latency issues that Dynatrace detected with services hosted in AWS. Further investigation would be needed, but this adds a data point to the problem: The latency issue affects other cloud services too, so it’s not rooted in the network on AWS side.

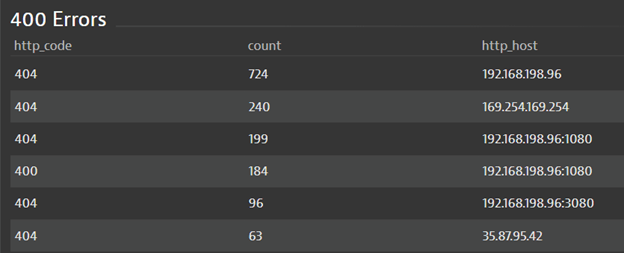
#2 Number of 404 errors per host
Applications suffering low-grade but persistent errors can also be detected from a bottom-up view. In Figure 3 an at-a-glance view of web applications shows increasing 400 error codes, which indicates a problem with application resources wasted for communication that brings no data. App teams can now analyze whether services on those hosts are failing, or clients are not using them properly, and whether this communication is needed at all in the application fabric.
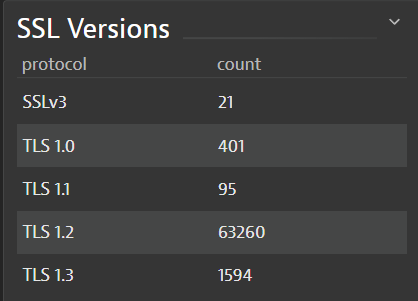
#3 Numbers of connections per TLS version
From an application security point of view, TLS versions can be quickly tracked and audited, as in Figure 4. App teams can objectively verify how their apps secure the network communication and proactively assure only the latest, secure TLS versions are enabled, before any red flags come up from the security team.
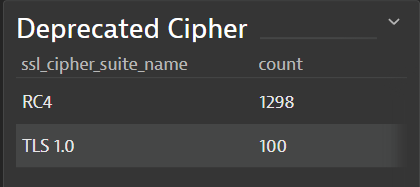
#4 Deprecated ciphers identified
Further investigation of the TLS ciphers in use can be especially useful in an IoT environment, where managing and monitoring those devices has its own set of challenges, like limited configurability and firmware versions with limited encryption capabilities. Factual evidence of the actual network communication security levels and which conversation endpoint decides on the negotiated security level helps app teams to select secure network communication libraries and device vendors.
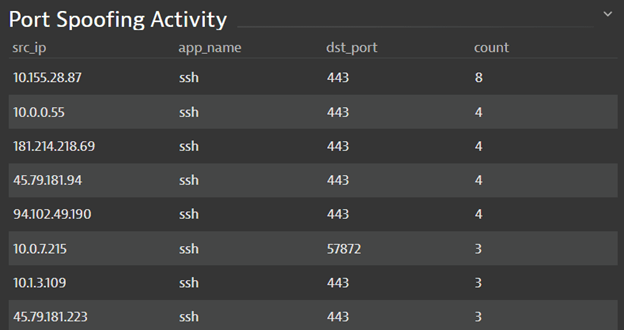
#5 Instances of port spoofing by SSH traffic and the port in use
Figure 6 shows port spoofing on nonstandard ports. Almost all network and application traffic classification tools would report this as HTTPS/web traffic when it actually is lateral movement inside the network. Naturally, such bogus traffic should not be present on the production network, and definitely not occupy network segments used by critical applications. App teams can raise flags early, involving security analysts to make sure that the app won’t get affected by network traffic of uncertain purpose.
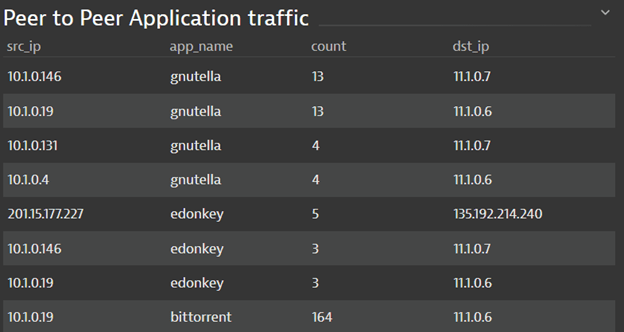
#6 Peer-to-peer connections on the network and protocols being used
Figure 7 shows another example of suspect traffic presence on production networks, where critical production apps exchange their transactions. Here we have several flavors of BitTorrent running. These may be sanctioned applications, but odds are they are not. Again, DevOps team can raise a flag to the security team, to make sure that production network is not abused.
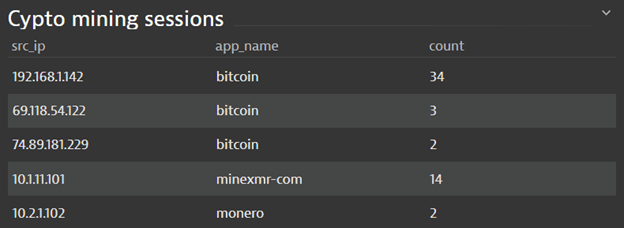
#7 Crypto mining activity identified on the network
Lastly, we can see crypto miners running on the network, as seen in Figure 8. Again, this activity could be very difficult to detect from a top-down view or from an unmonitored host. However, from the network perspective, it is very easy to spot with broad East-West application visibility.
Conclusion
The Gigamon Deep Observability Pipeline plus Dynatrace software intelligence platform offers an unparalleled view into network usage patterns in the context of applications and services, and also in general by focusing on adjacent traffic on the same network. This opens a view to the network-originating application performance influencers and into security and compliance in your hybrid cloud.
The joint Dynatrace and Gigamon solution lets you identify application issues that root down to the network usage patterns, known and unknown applications on the network, and any network configuration drift that may have taken place.
Maintaining good compliance and security requires continuous visibility from both top-down and bottom-up views. Visibility in and of itself isn’t security yet, but it is a mandatory check point, and it can detect basic network abuse patterns that can lead to bigger issues if left unaddressed. Once you have the basics covered, reach out for Dynatrace Application Security solution to add immunity to your application code.
For additional information, visit Gigamon and Dynatrace on the web:
- Gigamon Application Metadata Intelligence
- Dynatrace Infrastructure Monitoring
- Dynatrace Application Security
Featured Webinars
Hear from our experts on the latest trends and best practices to optimize your network visibility and analysis.

CONTINUE THE DISCUSSION
People are talking about this in the Gigamon Community’s Security group.
Share your thoughts today