


Automation and Orchestration — A Panacea for Digital Transformation? Part 2
This is the second post of a three-part series. Part 1 is available here.
IT teams are always struggling to keep up with the ever-growing list of service tickets, infrastructure upgrades, security compliance and monitoring events. Between the NetOps and InfoSec teams, there are thousands of cases handled every month (security alerts are more in the tens of thousands per day) in a typical large enterprise. Most of these teams still carry out manual tasks that could easily be automated.
Any type of investigation arising out of an event (security or network) needs a human intervention to divert a copy of traffic of interest to a tool that can give a detailed context to find out root cause and a potential fix.
These events could be anything from a slow-loading server page to a user trying to access a restricted database to a node connecting to a rogue DNS server. The incidents are usually observed on application monitoring tools, SIEMs and firewalls. Although some of the tools themselves have ability to report these events, the time taken to filter through false-positives and extracting the necessary traffic to an investigation tool is cumbersome.
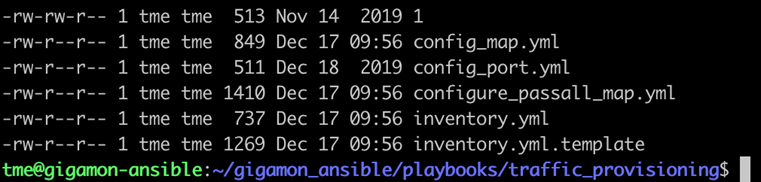
Gigamon introduced software-defined visibility a few years ago, which brought the agility and flexibility of REST APIs to automate the visibility platform. We now deliver an even, easy way of managing and configuring the visibility and analytics platform through Ansible playbooks.
The array of possibilities extends from using these playbooks to configure the system level properties of the Gigamon Visibility and Analytic Fabric™ to applying fabric maps to utilize GigaSMART™ SSL Decryption to inspect suspicious encrypted traffic.
A Sample Sequence of the System Events
The SoC receives an alert from one of their SIEM, EDR or NDR tools that an event has occurred that needs investigation. At this point, typically the security engineer looks at the alert, triages it and responds to the above alert depending on severity and type of event. For an anomaly that has a high risk, the triaging phase usually involves digging deep into the threat, finding the source of event and doing more analysis on this source machine. Some false positives also occur along this process which leads to productivity loss for the security operations team.
How to Tackle This Problem with Automation — Is There a Guide to Set Up My Orchestration and Automation Plan?
There are multiple ways to implement automation in your security or network operations. Most of them rely on few important requirements:
- Integration capabilities: It is critical that the tools involved in automating the process of threat response and analysis have the ability to integrate with each other. The SIEM, visibility fabric, orchestration engine and traffic capture tool need to communicate with each other so that appropriate actions are transferred and triggered based on automation flow.
- API support: A standard set of API (such as REST) to perform certain functions that modify or create new configuration in the tools is the quickest and preferred method when dealing with automation scripts and frameworks.
- Data format: Different tools ingest and send network traffic out in different formats. As a user it is important to understand which tool can handle which type of data when orchestrating a use case.
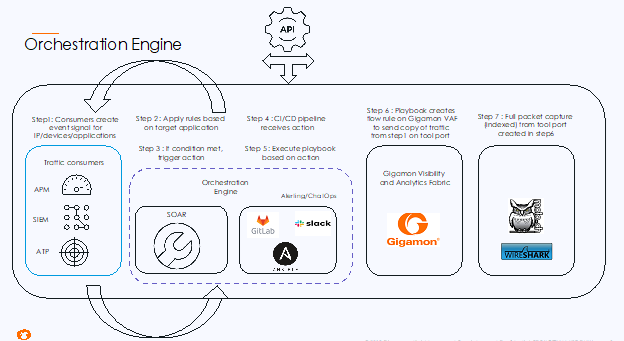
Flow Process of a Sample Use Case
All traffic from the production environment is tapped and aggregated using a combination of TAPs and GigaVUE® TA Series appliances. Duplicate traffic is de-duped, and encrypted traffic can be sent to a GigaSMART engine for decryption based on how and where the HC visibility fabric is placed.
The traffic from the GigaVUE HC appliance is sent to Gigamon ThreatINSIGHT™, a high-velocity network detection and response solution that categorizes threats. Based on the threat score, the user can enable a trigger to send the related metadata of that particular event to a Splunk Enterprise service.
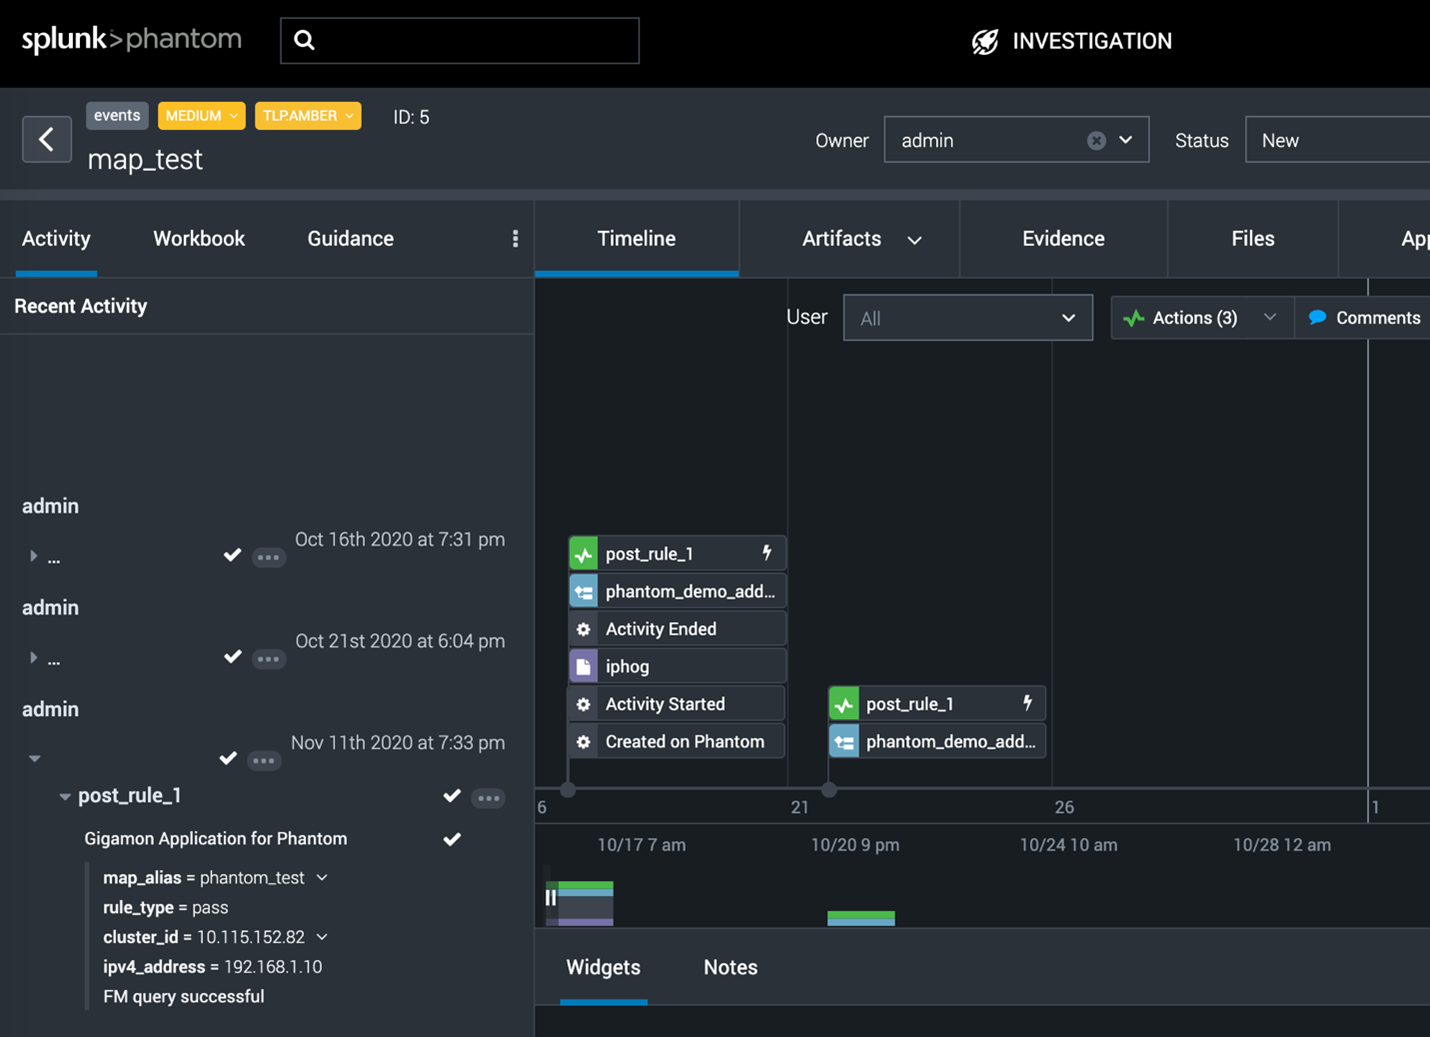
Let’s say a source IP of 192.168.1.10 has been trying to gain access to a restricted finance database server inside the organization. This IP address will be part of the metadata information sent to Splunk. An orchestration platform (Splunk Phantom in this example) can then be used to create a playbook that will interact with both Splunk and Gigamon GigaVUE-FM fabric manager.
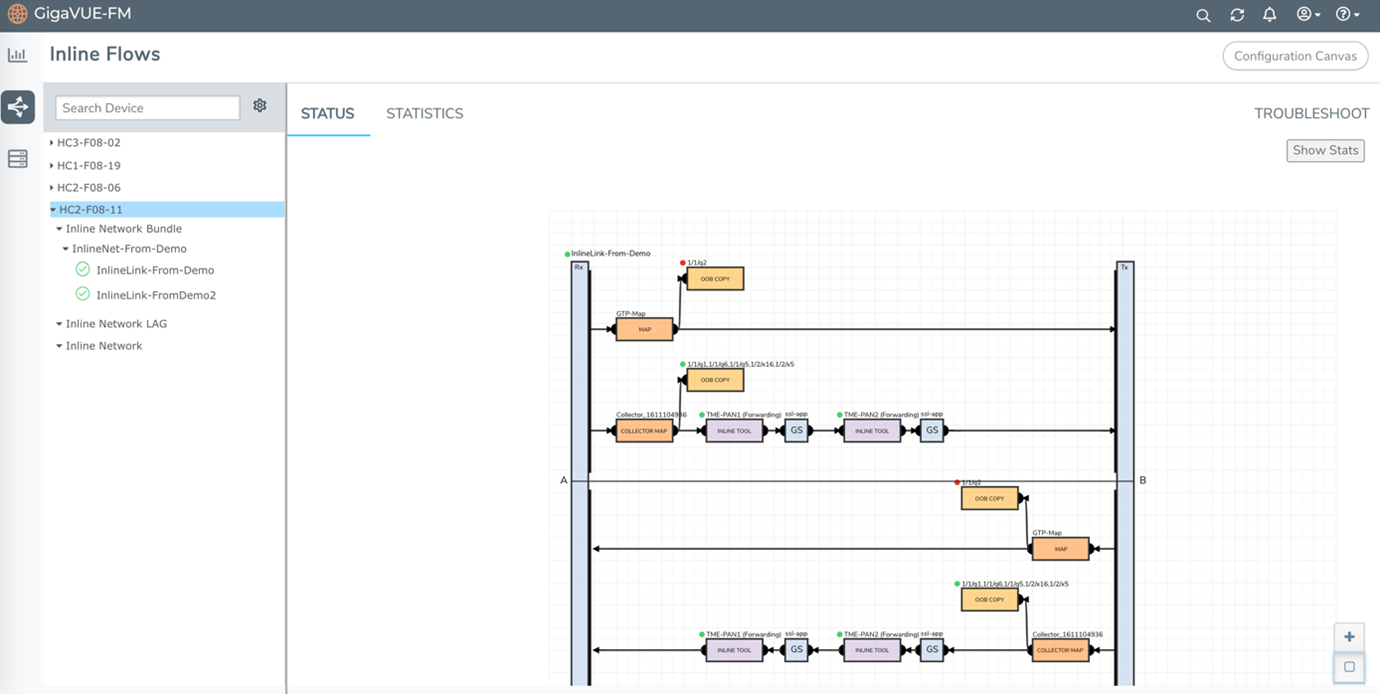
The next step in the playbook will be to create a flow map in GigaVUE-FM for the device that is obtaining the copy of input traffic. The destination for this flow map can be a tool port that sends all the traffic from that one IP address to a full packet capture tool. The packet capture tool can also be programmed to receive full traffic from this host for a defined period of time that will be sufficient to investigate the root cause.

If there is no SOAR platform in your environment, the team may also use Python scripts and Ansible packages in conjunction with a repository manager such as GitHub. Incorporating the repository manager ensures that whenever the pipeline fails or the system goes into a failure mode, the last working configuration can be easily reapplied, and troubleshooting is performed outside the production environment.
Key Takeaway
Given the scale of security threats and the time spent in detection or investigation, it is an added benefit of using Gigamon’s API and Ansible support to automate a similar use case as outlined above. It also demonstrates how vital the entire network context is when using security tools with the Visibility and Analytics Fabric. The flexibility and ease of use of standardized APIs gives the user unlimited possibilities for how a particular flow can be automated, allowing more time to improve the overall security posture of the organization.
Featured Webinars
Hear from our experts on the latest trends and best practices to optimize your network visibility and analysis.

CONTINUE THE DISCUSSION
People are talking about this in the Gigamon Community’s Security group.
Share your thoughts today